Here is a tip if you want to debug Silverlight applications from Visual Studio 2012 if it is running in Google Chrome or Firefox
Google Chrome :
- Run the application and select Debug –> Attach to Process from the menu
- From the Available Processes list, look for process named “chrome.exe” with type Silverlight
- Select that process and click the Attach button
Here is screenshot from my machine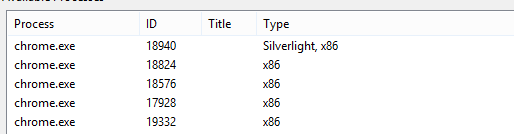
Mozilla Firefox :
Firefox has a slightly different approach
- Run the application and select Debug –> Attach to Process from the menu
- From the Available Processes list, look for process named plugin-container.exe
- Select that process and click the Attach button
Here is the screenshot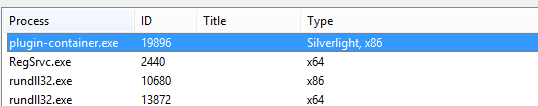
Voila!!! now you are able to get the breakpoints in Visual Studio